| STOCK MARKET SYNOPSIS | |||
| | Last Week | This Weeks | %Change |
Mkt. Cap (US$bn) | 26.73 | 25.44 | -4.83% |
Avg. Dly T/O (mn. shares) | 151.28 | 110.97 | -26.65% |
Avg. Dly T/O (US$ mn.) | 91.95 | 64.02 | -30.38% |
No. of Trading Sessions | 5 | 5 | |
KSE 100 Index | 7276.61 | 6894.62 | -5.25% |
KSE ALL Share Index | 5216.66 | 4953.17 | -5.05% |
STOCK MARKET SYNOPSIS
KSE PLAYS THE RANGE IN MAY-09
Limited triggers, budget blues, military offensive in Swat and absence of leveraged product resulted in the KSE-100 index oscillating in a range of just 4% in May-09.
* MoM the KSE return was 1%, while volumes fell ~47% MoM to US$75mn. The insipid month for the KSE combined with a healthy rally in regional markets meant that Pakistan now trades at ~56% discount to peers vs 49% a month ago.
* Coming off a very tough 2008, YoY economic indicators showed an improvement in April 2009. However, MoM numbers suggest signs of some pent up pressure.
* The initial part of June 2009 could follow a pattern similar to May 2009. In absence of triggers the market will remain apprehensive about potential new taxes in the budget in our view. In terms of our preferred exposures, we highlight Hub Power and PSO as our top picks as they provide a blend of value and growth in our view.
KASB Research
* MoM the KSE return was 1%, while volumes fell ~47% MoM to US$75mn. The insipid month for the KSE combined with a healthy rally in regional markets meant that Pakistan now trades at ~56% discount to peers vs 49% a month ago.
* Coming off a very tough 2008, YoY economic indicators showed an improvement in April 2009. However, MoM numbers suggest signs of some pent up pressure.
* The initial part of June 2009 could follow a pattern similar to May 2009. In absence of triggers the market will remain apprehensive about potential new taxes in the budget in our view. In terms of our preferred exposures, we highlight Hub Power and PSO as our top picks as they provide a blend of value and growth in our view.
KASB Research
FUNDAMENTAL CHANGES
SECP PROPOSES CUT IN COMPANIES' INCOME TAX RATE. As per media reports, the Securities & Exchange Commission of Pakistan (SECP) has proposed progressive reduction in tax rates for companies from 35% to 30% in the FY10E budget. Taking it a step further, the Federal Board of Revenue (FBR) is also reportedly actively examining the incorporation of the same in the upcoming Finance Bill 2009-10, whereby under the given tax slabs the rate of tax should be 33% for 2009 and 30% for 2010. Regionally Pakistan has the highest corporate tax rate with EU at 24%, OECD at 27.8%, Asia Pacific at 30% and Latin America at 28%.
* PRS2.9TRN OUTLAY FOR FY10E BUDGET. The Ministry of Finance (MoF) in a standing committee session before the National Assembly revealed an intended FY10 budget outlay of PRs2.9trn, with a revenue target of PRs1.41trn and expenditure of PRs2.1trn, including PRs0.66trn debt servicing, PRs0.34trn for defense and PRs0.25trn for grants and subsidies. PRs745bn has been proposed for the development outlay, including PRs400bn federal share, PRs200bn for provincial and PRs70bn for Benazir Income Support Program (BISP), PRs50bn for internally displaced people (IDPs) and PRs7bn for Bait-ul-Maal.
* MOP PROPOSED REPLACEMENT OF CROSS-SUBSIDY ON GAS PRICES WITH DIRECT SUBSIDY. The petroleum ministry has proposed to implement uniform gas tariff for all domestic and industrial consumers in the upcoming FY10 budget. As per the reported estimates, domestic consumers and fertilizer sector were given cross-subsidy of PRs23bn and PRs11bn respectively during FY09. Domestic consumers (first slab) enjoys 54-75% discount while fertilizer sector (feedstock only) gets 72% discount in gas prices compared Pakistan Update - June 05, 2009 to general industries where the average price discount given to these sectors are covered via higher gas prices charged from other sectors including IPPs, cement, CNG stations and other commercial users.
The petroleum ministry has proposed that the finance ministry provide a direct gas price subsidy to these two sectors via gas utilities instead of charging higher rates for other sectors. If such proposal is accepted, it will have muted impact on fertilizer companies and domestic consumers with just a change of source of subsidizing the gas prices while it will positive for industries currently charged higher gas prices. The chances of this materializing seems dim to us due to the recent efforts being taken by the govt. to eliminate all kind of direct cash subsidies under IMF regime.
* PRS2.9TRN OUTLAY FOR FY10E BUDGET. The Ministry of Finance (MoF) in a standing committee session before the National Assembly revealed an intended FY10 budget outlay of PRs2.9trn, with a revenue target of PRs1.41trn and expenditure of PRs2.1trn, including PRs0.66trn debt servicing, PRs0.34trn for defense and PRs0.25trn for grants and subsidies. PRs745bn has been proposed for the development outlay, including PRs400bn federal share, PRs200bn for provincial and PRs70bn for Benazir Income Support Program (BISP), PRs50bn for internally displaced people (IDPs) and PRs7bn for Bait-ul-Maal.
* MOP PROPOSED REPLACEMENT OF CROSS-SUBSIDY ON GAS PRICES WITH DIRECT SUBSIDY. The petroleum ministry has proposed to implement uniform gas tariff for all domestic and industrial consumers in the upcoming FY10 budget. As per the reported estimates, domestic consumers and fertilizer sector were given cross-subsidy of PRs23bn and PRs11bn respectively during FY09. Domestic consumers (first slab) enjoys 54-75% discount while fertilizer sector (feedstock only) gets 72% discount in gas prices compared Pakistan Update - June 05, 2009 to general industries where the average price discount given to these sectors are covered via higher gas prices charged from other sectors including IPPs, cement, CNG stations and other commercial users.
The petroleum ministry has proposed that the finance ministry provide a direct gas price subsidy to these two sectors via gas utilities instead of charging higher rates for other sectors. If such proposal is accepted, it will have muted impact on fertilizer companies and domestic consumers with just a change of source of subsidizing the gas prices while it will positive for industries currently charged higher gas prices. The chances of this materializing seems dim to us due to the recent efforts being taken by the govt. to eliminate all kind of direct cash subsidies under IMF regime.
OUTLOOK FOR THE FUTURE
The near term direction of the market in our view remains pegged to news flow on the budget and potential developments on re-introduction of a leverage product in the market. In addition, the market should also continue to keep an eye on the law and order situation, the trend in international oil prices and the recent up tick in foreign activity for a direction, in a market otherwise devoid of significant triggers. From a budget point of view, we highlight cement as the key beneficiary of higher PSDP allocation, start of construction work on Bhasha Dam and reconstruction activities in affected areas. Our preferred picks in the sector remain LUCK (PO: PRs65/sh) and DGKC (PO: PRs33.50/sh). Any roadmap given by the government on potential resolution of the inter-corporate debt issue by the close of the fiscal year (30th Jun) should bode well for both IPPs (HUBC and KAPCO are Buy rated) and OMCs (PSO and APL are buy rated). Meanwhile, we continue to favor stocks with greater earnings visibility and high dividend yields. Our preferred picks other than the above remain E&Ps (PPL, POL), fertilizers (FFC) and telecom (PTCL).
MARKET THIS WEEK
The KSE ended the week in better spirits than were witnessed during most of the week's lackluster performance - in terms of both index direction and volumes. The week witnessed a mixed-bag of news regarding the upcoming budget and geopolitical developments. Government plans to end electricity, gas and oil subsidies and enhance tax net to include services and real estate sectors kept investors nervous. At the same time, SBP's quarterly report stated risks to both the economy and banking sector (although amply capitalized to absorb any shocks) which also put pressure on the sector. On the flip side, however, the market cheered NEC (National Economic Commission) clearance of PRs621bn PSDP for FY10 and the positive intent showed by stakeholders' in introducing leverage financing products in the market. Dow Jones' announcement to include Pakistan in DJ-FEAS (Federation of European and Asian Stock Exchanges) Composite Index -with 9.3% share - is also a positive development though the real benefits in term of FII flows may take time to materialize. In sector specific news, while strong oil prices continued to buoy sentiment in the oil sector, banking spread during April 2009 shrunk by 12bp MoM to 7.54%. On the telecom front, the government is planning to cut SIM activation tax from PRs500 to PRs300 that should save ~PRs2.7bn to cellular companies who currently subsidize the amount.
Cement exports surpass 10 million tons mark
KARACHI: The country's cement exports have registered a healthy growth of 50 percent to reach all time high level of 10 million tons during eleven months of the current fiscal year 2008-09 on account of rising international demand, industry sources said.
They said that easy availability of raw material and regional cement shortages played a key role in achieving landmark of highest ever cement exports, while enhancing production capacity by the local cement manufacturers is another reason behind this achievement.
"Local cement manufacturers are taking full advantage of regional shortage and with current achievement Pakistan has become the largest cement exporter country of the region," they said. They said that strong external demand from the Persian Gulf countries and neighbour countries like Afghanistan and India had pushed the country's cement exports, which may touch 11 million tons mark by the end of current fiscal year.
Cement exports have posted a robust increase of 49.47 percent to new peak of 10.163 million tons during July-May of current fiscal year as compared to 6.8 million tons in the same period of last fiscal year. Exports during eleven months are also some 37 percent higher than last fiscal year's exports of 7.716 million tons.
Afghanistan and India are two largest importers of Pakistan's cement, besides Gulf countries. Afghanistan imported 2.83 million tons as compared to 2.54 million tons in same period of 2008. India's cement import from Pakistan stood at 0.599 million tons during the period relative to 0.689 million tons of corresponding period of last fiscal year. Cement exports to other countries surged by 121 percent to 5.84 million tons as against 2.64 million tons in the same period of fiscal year 2008.
Meanwhile, local cement dispatches declined by 15 percent to 17.557 million tons during eleven months as compared to 20.64 million tons in the same period of last fiscal year. Huge supply of cement against the low demand decreased the local dispatches in the local market and due to high competition cement companies are decreasing their prices to capture the market, industry sources said.
They said that easy availability of raw material and regional cement shortages played a key role in achieving landmark of highest ever cement exports, while enhancing production capacity by the local cement manufacturers is another reason behind this achievement.
"Local cement manufacturers are taking full advantage of regional shortage and with current achievement Pakistan has become the largest cement exporter country of the region," they said. They said that strong external demand from the Persian Gulf countries and neighbour countries like Afghanistan and India had pushed the country's cement exports, which may touch 11 million tons mark by the end of current fiscal year.
Cement exports have posted a robust increase of 49.47 percent to new peak of 10.163 million tons during July-May of current fiscal year as compared to 6.8 million tons in the same period of last fiscal year. Exports during eleven months are also some 37 percent higher than last fiscal year's exports of 7.716 million tons.
Afghanistan and India are two largest importers of Pakistan's cement, besides Gulf countries. Afghanistan imported 2.83 million tons as compared to 2.54 million tons in same period of 2008. India's cement import from Pakistan stood at 0.599 million tons during the period relative to 0.689 million tons of corresponding period of last fiscal year. Cement exports to other countries surged by 121 percent to 5.84 million tons as against 2.64 million tons in the same period of fiscal year 2008.
Meanwhile, local cement dispatches declined by 15 percent to 17.557 million tons during eleven months as compared to 20.64 million tons in the same period of last fiscal year. Huge supply of cement against the low demand decreased the local dispatches in the local market and due to high competition cement companies are decreasing their prices to capture the market, industry sources said.
Merger of Askari, Mybank likely
KARACHI: Askari Leasing on Tuesday expressed its intentions to merge with sister concern Askari Bank, which in turn wants to amalgamate with Mybank, in what experts say is a survival bid by smaller banks to consolidate their businesses.
In two separate notifications issued to Karachi Stock Exchange, Askari Leasing and Askari Bank announced that the decisions were taken by their respective board of directors earlier in the day.
Askari Bank has yet to seek approval of State Bank of Pakistan (SBP) before it starts due diligence of the books of Mybank, the notification said.
The merger is an attempt by the two banks to raise their capital to a level sufficient enough to meet SBP’s minimum capital requirement (MCR).
According to accounts for first Jan-Mar 2009 quarter, both banks have met the MCR of Rs5 billion for 2008 but they would have to raise it by a further Rs1 billion by this year’s end.
“For smaller banks, there is an issue of survival with rising non-performing loans and slowing economy,” said Khurram Shahzad, a research analyst at Investcap. “We will see more mergers in near future.”
Atlas Bank and Silkbank are already in negotiations over a possible merger. These two banks have failed to meet the MCR for 2009.
The central bank has warned against slowdown in deposit growth. Smaller banks with limited branch network face challenge of mobilizing deposits and mergers to form larger entities seems to be a natural outcome.
Now banks are required to have MCR of Rs6bn by end 2009 and then they have to increase it by Rs1bn each year till 2013.
Pakistan, China vow to increase border trade
BEIJING (APP) - Pakistan and China would intensify their efforts to increase bilateral trade through land route,
Ambassador Masood Khan said Thursday.
Ambassador Khan who led a delegation to the 5th Central and South Asian Commodity Fair organized by
Kashgar prefecture told APP after three day visit to Kashgar.
He said that two more delegations from Pakistan participated in the fair. Syed Ahmed Hussain Shah, NWFP
Industries Minister, and Babar Yaqoub Fateh Muhammad, Chief Secretary Northern Areas, led these
delegations in the trade fair which was largely attended by diplomats and delegations of several Central Asian
and South Asian countries.
Besides, official delegations, hundreds of Pakistani businessmen participated in the seminar. There were about
more than 80 Pakistani exhibitors who established their stalls in the international fair.
During his visit, Ambassador Masood Khan said he held in-depth talks with Commissioner of Kashgar Akbar
Gopur to explore ways and means to strengthen economic and trade ties between Xinjiang and Northern Areas
of Pakistan.
“Border trade right now constitutes merely 5% of the overall trade.
Both sides are keen to enhance overall trade and increase the volume of bilateral trade which has immense
potential”, Ambassador Khan observed.
The border trade takes place through Karakoram Highway (KKH) also known as Pakistan-China friendship
highway. Extensive work is being done to repair and upgrade the KKH of the Pakistani side. The repair and
upgradation is likely to be completed by 2011-2012, Khan said. “With upgradation of KKH, the volume of trade
would increase, the speed of transportation would pick up”, the Pakistani Ambassador said.
Ambassador Masood Khan visited Pakistani stalls, mingled with Pakistani businessmen and talked about trade
potential between Pakistan and China and how it can further be enhanced.
He also visited Pakistan trade house in Kashgar and addressed a large gathering of Pakistanis. The gathering
was hosted by Zahid Traders, a leading Pakistani enterprise doing business in Pakistan, Xinjiang, and Central
Asia. Kashgar Government also organized a culture evening during which a popular Xinjiang Singer Muhammad
Amin sang Pakistan’s national song “Ye mera Pakistan he; ye tera Pakistan he”, this made all Pakistanis proud
and several of them rushed to the stage to sing and dance with Chinese singer.
Japan banks Shinsei, Aozora to merge
TOKYO: Japanese lenders Shinsei and Aozora, both deep in the red due to the global financial crisis, announced on Wednesday plans for a merger that would create the nation’s sixth biggest commercial bank.
The two banks, which together lost about four billion dollars in the year to March because of exposure to the US financial meltdown, admitted to past mistakes and vowed a fresh start with a tie-up.
Shinsei’s president and chief executive Masamoto Yashiro, who was brought back to the post last year after American CEO Thierry Porte stepped down, said his bank lost its way because of “reckless investment overseas.”
“The bank made high-risk investment, thinking only of profits and not risk,” he said. “We will never repeat this.”
Shinsei and Aozora were both bailed out with public money during Japan’s 1990s banking crisis and later sold to private US investors.
They are still struggling to find a niche in the face of a weak economy and tough competition with larger rivals and regional lenders.
Yashiro said the combined bank “will aim to become a unique company that is neither a mega bank nor a regional financial institution.”
The two lenders have agreed to a merger of equals that is expected to take effect by October 2010.
Norito Ikeda, a former banking executive chosen to head the combined group, compared it to the Kanrin-maru, Japan’s first ship to cross the Pacific Ocean in the mid-19th century and come back again.
“I was appointed as the captain who will bring back the Kanrin-maru, which has gone to the United States, back to Japan.”
Ikeda, now an advisor to management consultants A T Kearney K K, oversaw the revival of regional lender Ashikaga Bank.
SBP chief leaves for Dubai for IMF talks
ISLAMABAD: Pakistan's talks with the International Monetary Fund (IMF) on the 23-month Standby Arrangement have entered policy level with confidence of meeting almost all performance criteria and quantitative targets set by IMF. Policy level talks will be started by State Bank Governor Salem Raza as he reaches Dubai for monetary policy and exchange rate issues, sources said.
Advisor to Prime Minister on Finance Shaukat Tarin will reach Dubai directly from Washington day after for conclusion of talks, which are going on track, sources said. Pakistan's team is placing greater emphasis on getting some fiscal space from the Fund staff who would file a report for the IMF Board on the conclusion of the talks by May 11, in case all goes well. IMF Board would take its time to consider approval of the third tranche of $850 million.
Pakistan would also hold discussion on its request for upsizing its program by $4..1 billion from $7.6 billion Tarin has also raised this issue with IMF officials in Washington spring meeting, where he received encouraging response. He also met US Treasury officials to get support at the Fund Board, which have a strong leverage in such approval for countries laden with more political issues.
Pakistan has met almost all its actions by end-March for which the talks are meant. Fiscal deficit is already at 3.1 percent of the GDP, while the target was 3.2 percent. In tax collection, it is Rs 13 billion behind its target, which is covered through petroleum development levy. Though it leaves no room for extravagant spending on large government, growing defence needs and huge debt servicing.
Expenditures to save poor, like development, have already been sacrificed by the government for stability and other "untouchables" in the government allocations. Pakistan is also meeting its other targets like phasing out payments of oil purchase from open market rather than SBP forex reserves. It has also developed a plan for small banks and eliminating energy subsidies.
It is also on its way to frame a proper strategy and a time-bound action plan for adoption of specific measures to strengthen the social safety net and improve targeting to the poor, with the technical and financial assistance of the World Bank. Pakistan's balance of payments requirements are also easily being met through its available resources this year but by next year, in case of any upheaval, these issues can re-emerge.
The government has also prepared a plan for eliminating the inter-corporate circular debt by end-March, which has also been prepared and submitted to IMF. IMF is also assured that and update on transition to a single treasury account will be completed by end-June 2009. IMF has also been given assurance for structural performance criteria with the view to eliminating tariff differential subsidies by end-June 2009.
The Fund mission was also told by SBP Governor that his Bank's provision for foreign exchange for furnace oil had been eliminated by February 1. The government has also talked about amendments to the banking legislation, which will be submitted to Parliament to enhance the effectiveness of SBP enforcement powers in the area of banking supervision by end-June 2009.
Yen Falls
The yen weakened against the New Zealand dollar yesterday after Kyodo News reported Japan may consider investing about 10 percent of its public pension-reserve funds in assets with “high risks and high returns.”
Japan’s pension-reserve balance was 123 trillion yen ($1.28 trillion) as of March 2009, Kyodo said, citing Health Minister Yoichi Masuzoe.
“If the government wants to buy more foreign bonds for its public pension reserve funds, that’s yen negative,” said Masaki Fukui, a senior market economist in Tokyo at Mizuho Corporate Bank Ltd., Japan’s second-largest publicly traded lender.
The losses cut the yen’s weekly gain against the New Zealand dollar to 1.6 percent. Japan’s currency climbed 0.2 percent against the Australian dollar this week to 76.72 yen.
Dollar Index
The Dollar Index increased 0.3 percent to 80.403, bringing its gain this week to 0.7 percent. It reached 80.578 on July 2, the highest level since June 25. The index rebounded from 78.334 on June 2, the weakest level this year.
The pound weakened against 15 of the 16 most-actively traded currencies this week. Growth in U.K. service industries slowed in June, giving the Bank of England more reason to keep its key interest rate at a record low of 0.5 percent. Gross domestic product shrank in the first quarter by the most since 1958, the Office for National Statistics said June 30.
An index based on a U.K. survey of about 700 service companies by the Chartered Institute of Purchasing and Supply fell to 51.6 in June, from 51.7 in May, a report showed yesterday.
Investors should sell the pound on speculation the central bank will expand asset purchases when it meets to set monetary policy next week, strategists led by Hans-Guenter Redeker, global head of foreign-exchange strategy at BNP Paribas SA, wrote in a client note yesterday.
Dollar continues to gain versus rupee in the open market
The US currency continued to rise in the local market against rupee amid significant jump in dollar’s demand here. The American dollar commenced new day’s trading at Rs.81/50, posted major gains on the local desk and was unchanged at close of markets on Saturday. Thus, rupee ended the day on a negative versus dollar in the kerb. The dollar rose against the euro this week as speculation the economic recovery is faltering boosted demand for the safety of the U.S. currency. The Dollar Index, which tracks the currency against six major U.S. trading partners, advanced to near the highest in a week after a report showed U.S. employers cut more jobs last month than economists forecast. The pound had its first weekly loss in a month after a report showed U.K. service industries were little changed in June as the recession persisted.
“We had a disappointing jobs figure and data has generally tended to underwhelm,” said Steven Barrow, head of Group of 10 currency research in London at Standard Bank Plc, who forecast the dollar may gain to $1.38 per euro next week. “Risk aversion is increasing a little bit and that’s helped the dollar.”
The dollar advanced 0.5 percent to $1.3984 per euro as of 2:08 p.m. in New York yesterday, from $1.4056 at the end of last week. It reached $1.3929 yesterday, the strongest level since June 25. The yen was at 134.27 per euro, from 133.85 a week earlier. The U.S. currency rose 0.9 percent to 96.00 yen.
The pound was at $1.6328, for a weekly decline of 1.2 percent. The U.K. currency declined 0.3 percent in the week to 156.77 yen, after reaching the weakest level since June 25.
US Dollar: Will Heavy Event Risk Stem the Bleeding?
Fundamental Outlook for US Dollar: Neutral
- Consumer confidence rises to an eight month high; but is this optimism warranted?
- Durable goods orders jump and housing statistics continue their slow improvement
- Despite a positive revision to first quarter growth, the US economy trudged through its worst six months is 50 years
The statistics on the US dollar are ghastly. Through the month of May, the world’s most actively traded currency plunged 547 pips or 6.5 percent on a traded weighted basis to its lowest level this year. With the momentum building, there was no shortage of reason to sell this currency. The 1Q GDP revisions confirmed the country’s worst six month period of economic activity in 51 years. Policy officials warned that a recovery could be pushed back into 2010. Rising national debt levels intensified speculation that the US sovereign debt rating was in jeopardy. And, once again, international calls to abandon the US dollar as a reserve currency were amplified. All of these are legitimate concerns; but none of them are new or immediate problems. This is what is important to remember heading into the coming week. Risk appetite will no doubt has its influence on the greenback; but a dense list of high-level event risk (from the US docket and abroad) will cast the battered currency in a more objective light as we see where the US really stands in the global scale between economic depression and recovery.
Referring to the dollar’s own calendar, fundamental traders will respond to a wide range of proven market movers. The scope of the list will cover nearly every facet of the US economy and will therefore better qualify speculation as to whether the there are signs of ‘green shoots.’ This is a misleading and perhaps overused term that allude to the beginning signs of growth. Like the rest of the world, the United States if far from growth; and what speculators benchmark now is the deceleration in the pace of contraction. Topping the list for potential impact (as it usually does) is the monthly non-farm payrolls report. The consensus from Bloomberg’s survey economists projects another 521,000 jobs lost through May. It is first interesting to note that the spread on expectations has grown to be relatively tight (forecasts range between a 450,000 and 600,000 drop). More important though is the pace of job losses. If this figure prints as expected, it would mark the second month that the rate of payroll reductions slowed and it would be an overall, significant improvement on January’s record breaking 741,000. As the leading indicator for economic health, a steady improvement of this caliber could single-handedly convert a bulk of the market to believers that the world’s largest economy is on track to recovery ahead of its major trade partners.
Nothing to scoff at itself, the rest of the data crossing the wires over the coming week will cover the health of the individual sectors in a little more detail. Consumers – whose spending accounts for 70 percent of the economy – will evaluated through personal income, spending and credit figures. If we are to expect a genuine economic recovery before the end of the year, we should see a turn in these figures relatively soon. From the business side of things, the ISM manufacturing and services sector surveys are due on Monday and Wednesday respectively. The outlook for factory activity has been negative for 15 months now and services seven – though the reversal since the end of 2008 has been relatively aggressive. Finally, the pending home sales figure will be a lagging indicator for the housing market, but consistent improvements from data in this group will eventually pan out to a true revival.
Alone, the round of US data will gauge how the American economy is performing compared to last month, last quarter and last year. However, for currency traders, the Forex market is a relative game in which the pace of US growth and returns must be set against its global counterparts to gauge the strength of the dollar. In this capacity, we must set the dollar against the backdrop of the major releases from other economies next week. The list of notables includes: the RBA, BoC, ECB and BoE rate decisions; Canadian 1Q GDP; Australia 1Q GDP; Swiss 1Q GDP; Canadian employment; and 1Q Japanese capital spending among others.
- Consumer confidence rises to an eight month high; but is this optimism warranted?
- Durable goods orders jump and housing statistics continue their slow improvement
- Despite a positive revision to first quarter growth, the US economy trudged through its worst six months is 50 years
The statistics on the US dollar are ghastly. Through the month of May, the world’s most actively traded currency plunged 547 pips or 6.5 percent on a traded weighted basis to its lowest level this year. With the momentum building, there was no shortage of reason to sell this currency. The 1Q GDP revisions confirmed the country’s worst six month period of economic activity in 51 years. Policy officials warned that a recovery could be pushed back into 2010. Rising national debt levels intensified speculation that the US sovereign debt rating was in jeopardy. And, once again, international calls to abandon the US dollar as a reserve currency were amplified. All of these are legitimate concerns; but none of them are new or immediate problems. This is what is important to remember heading into the coming week. Risk appetite will no doubt has its influence on the greenback; but a dense list of high-level event risk (from the US docket and abroad) will cast the battered currency in a more objective light as we see where the US really stands in the global scale between economic depression and recovery.
Referring to the dollar’s own calendar, fundamental traders will respond to a wide range of proven market movers. The scope of the list will cover nearly every facet of the US economy and will therefore better qualify speculation as to whether the there are signs of ‘green shoots.’ This is a misleading and perhaps overused term that allude to the beginning signs of growth. Like the rest of the world, the United States if far from growth; and what speculators benchmark now is the deceleration in the pace of contraction. Topping the list for potential impact (as it usually does) is the monthly non-farm payrolls report. The consensus from Bloomberg’s survey economists projects another 521,000 jobs lost through May. It is first interesting to note that the spread on expectations has grown to be relatively tight (forecasts range between a 450,000 and 600,000 drop). More important though is the pace of job losses. If this figure prints as expected, it would mark the second month that the rate of payroll reductions slowed and it would be an overall, significant improvement on January’s record breaking 741,000. As the leading indicator for economic health, a steady improvement of this caliber could single-handedly convert a bulk of the market to believers that the world’s largest economy is on track to recovery ahead of its major trade partners.
Nothing to scoff at itself, the rest of the data crossing the wires over the coming week will cover the health of the individual sectors in a little more detail. Consumers – whose spending accounts for 70 percent of the economy – will evaluated through personal income, spending and credit figures. If we are to expect a genuine economic recovery before the end of the year, we should see a turn in these figures relatively soon. From the business side of things, the ISM manufacturing and services sector surveys are due on Monday and Wednesday respectively. The outlook for factory activity has been negative for 15 months now and services seven – though the reversal since the end of 2008 has been relatively aggressive. Finally, the pending home sales figure will be a lagging indicator for the housing market, but consistent improvements from data in this group will eventually pan out to a true revival.
Alone, the round of US data will gauge how the American economy is performing compared to last month, last quarter and last year. However, for currency traders, the Forex market is a relative game in which the pace of US growth and returns must be set against its global counterparts to gauge the strength of the dollar. In this capacity, we must set the dollar against the backdrop of the major releases from other economies next week. The list of notables includes: the RBA, BoC, ECB and BoE rate decisions; Canadian 1Q GDP; Australia 1Q GDP; Swiss 1Q GDP; Canadian employment; and 1Q Japanese capital spending among others.
Forex Strategy Books
Forex strategy e-books that are listed here provide information on the specific trading strategies as well as the use of particular Forex trading instruments. Basic knowledge of Forex trading is required to correctly understand and use these strategies.
Almost all Forex e-books are in .pdf format. You'll need Adobe Acrobat Reader to open these e-books. Some of the e-books (those that are in parts) are zipped.
If you are the copyright owner of any of these e-books and don't want me to share them, please, contact me and I will gladly remove them.
1-2-3 System — A simple pattern trading system by Mark Crisp.
Bollinger Bandit Trading Strategy — A trading system based on Bollinger bands indicator by unknown author.
Value Area — from The Likos Letter.
The Dynamic Breakout II Strategy — by unknown author.
Ghost Trader Trading Strategy — by unknown author.
King Keltner Trading Strategy — by unknown author.
Scalp Trading Methods — by Kevin Ho.
LSS - An Introduction to the 3-Day Cycle Method — by George Angell.
Market Turns And Continuation Moves With The Tick Index — by Tim Ord.
The Money Manager Trading Strategy — by unknown author.
Picking Tops And Bottoms With The Tick Index — by Tim Ord.
The Super Combo Day Trading Strategy — by unknown author.
The Eleven Elliott Wave Patterns — by unknown author.
The Thermostat Trading Strategy — by unknown author.
Intraday trading with the TICK — by Christopher Terry.
Traders Trick Entry — by Traders Educators of Traders University.
Fibonacci Trader Journal — a journal covering different trading techniques based on Fibonacci indicators, by Robert Krausz. 12 issues.
Rapid Forex — a set of aggressive Forex trading strategies (Rapid Forex) by Robert Borowski and Stephen A. Pierce.
Microtrading the 1 Minute Chart — a small e-book aimed on Forex newbies to teach them the basics of M1 scalping.
BunnyGirl Forex Trading Strategy Rules and FAQ — set of rules for a BunnyGirl trading strategy based on WMA crossing.
The Daily Fozzy Method — by Michael Dunbar.
Forex Trader's Cheat Sheet — real Forex cheat sheet for position entry times/conditions by Quantum Research Management Group.
Offset Trading — a basic Forex news trading range breakout system by Dana Martin.
How to Trade Both Trend and Range Markets by Single Strategy? — by S.A. Ghafari.
A Practical Guide to Technical Indicators; Moving Averages — by S.A. Ghafari.
FX Wizard — essential Forex trading rules by Rob Walton.
FX Destroyer — a description of a rather simple Forex trading strategy, invloving moving averages, parabolic SAR and ADX indicators, by Izu Franks.
A Practical Guide to Swing Trading — a simple and practical guide to the swing trading strategy, by Larry Swing.
Practical Fibonacci Methods for Forex Trading — practical guide to Fibonacci levels with the real trade examples of the Forex strategy based on these levels, by Ken Marshall and Rob Moubray.
Using The Heikin-Ashi Technique — a short but detailed guide to trading using Heikin-Ashi charting technique, by Dan Valcu.
The Day Trade Forex System — an indicator-based strategy with detailed description, chart examples and minor advertising, by Erol Bortucene and Cynthia Macy.
5/13/62 — a revised and updated EMA-based Forex trading strategy explained in the 3-grade language, by Rob Booker.
Not So Squeezy Trading Manual — a description for the rather interesting trading strategy that utilizes indicators package under the same name, by Akuma99.
KobasFX Strategy — a simple MA+MACD Forex trading strategy by Obaseki O. A.
Positive Revision of CPI Spurs EUR/USD Growth
The U. S. dollar fell against the euro today as the consumer price index report showed a positive revision of the April’s value and also a higher than expected value for May. EUR/USD is now trading near 1.3855.
CPI rose by 0.1% in May in the United States after remaining unchanged in Aprl (revised from -0.7% reported a month ago). The forecasts for May were averaged near 0.9% decline.
Current account balance deficit decreased to $101.5 billion in the first quarter of 2009 (preliminary value). Q4 2008 deficit was revised from $132.8 billion to $154.9 billion. Latest Q1 deficit is the lowest since the fourth quarter of 2001, but it’s still above the median forecast of $85 billion.
Crude oil inventories decreased by 3.9 million barrels last week after falling by 4.4 million barrels one week earlier.
Forex Technical Analysis for 06/29—07/03 Week
EUR/USD trend: sell.
GBP/USD trend: buy.
USD/JPY trend: sell.
EUR/JPY trend: sell.
| Floor Pivot Points | |||||||
|---|---|---|---|---|---|---|---|
| Pair | 3rd Sup | 2nd Sup | 1st Sup | Pivot | 1st Res | 2nd Res | 3rd Res |
| EUR/USD | 1.3520 | 1.3634 | 1.3785 | 1.3898 | 1.4049 | 1.4162 | 1.4313 |
| GBP/USD | 1.5891 | 1.6039 | 1.6265 | 1.6413 | 1.6640 | 1.6787 | 1.7014 |
| USD/JPY | 91.93 | 93.72 | 94.99 | 96.78 | 98.05 | 99.84 | 101.11 |
| EUR/JPY | 126.36 | 129.35 | 131.75 | 134.74 | 137.15 | 140.13 | 142.54 |
| Woodie’s Pivot Points | |||||
|---|---|---|---|---|---|
| Pair | 2nd Sup | 1st Sup | Pivot | 1st Res | 2nd Res |
| EUR/USD | 1.3643 | 1.3803 | 1.3908 | 1.4068 | 1.4172 |
| GBP/USD | 1.6058 | 1.6305 | 1.6433 | 1.6680 | 1.6807 |
| USD/JPY | 93.59 | 94.74 | 96.65 | 97.80 | 99.71 |
| EUR/JPY | 129.20 | 131.46 | 134.60 | 136.85 | 139.99 |
| Camarilla Pivot Points | ||||||||
|---|---|---|---|---|---|---|---|---|
| Pair | 4th Sup | 3rd Sup | 2nd Sup | 1st Sup | 1st Res | 2nd Res | 3rd Res | 4th Res |
| EUR/USD | 1.3790 | 1.3863 | 1.3887 | 1.3911 | 1.3960 | 1.3984 | 1.4008 | 1.4081 |
| GBP/USD | 1.6286 | 1.6389 | 1.6424 | 1.6458 | 1.6527 | 1.6561 | 1.6595 | 1.6698 |
| USD/JPY | 94.58 | 95.42 | 95.70 | 95.98 | 96.55 | 96.83 | 97.11 | 97.95 |
| EUR/JPY | 131.19 | 132.67 | 133.17 | 133.66 | 134.65 | 135.14 | 135.64 | 137.12 |
| Tom DeMark’s Pivot Points | ||||
|---|---|---|---|---|
| Pair | EUR/USD | GBP/USD | USD/JPY | EUR/JPY |
| Resistance | 1.3974 | 1.6526 | 98.95 | 135.94 |
| Support | 1.3709 | 1.6152 | 95.89 | 130.55 |
| Fibonacci Retracement Levels | ||||
|---|---|---|---|---|
| Pairs | EUR/USD | GBP/USD | USD/JPY | EUR/JPY |
| 100.0% | 1.4012 | 1.6560 | 98.57 | 137.73 |
| 61.8% | 1.3911 | 1.6417 | 97.40 | 135.67 |
| 50.0% | 1.3879 | 1.6373 | 97.04 | 135.04 |
| 38.2% | 1.3848 | 1.6329 | 96.68 | 134.40 |
| 23.6% | 1.3810 | 1.6274 | 96.23 | 133.61 |
| 0.0% | 1.3747 | 1.6186 | 95.51 | 132.34 |
Forex Chart Patterns — EUR/JPY and GBP/USD
Another set of chart patterns — this time for the EUR/JPY and GBP/USD Forex pairs. Only two patterns are presented this time because other interesting patterns are now in that stage when it’s already too late to enter any positions based on them. I hope that you can use the patterns shown in this post. They are not 100% profitable trades but still offer a good entry point for medium-term traders. Click the images to get the full-size screenshots of the charts.
1. GBP/USD, Daily, Ascending Triangle: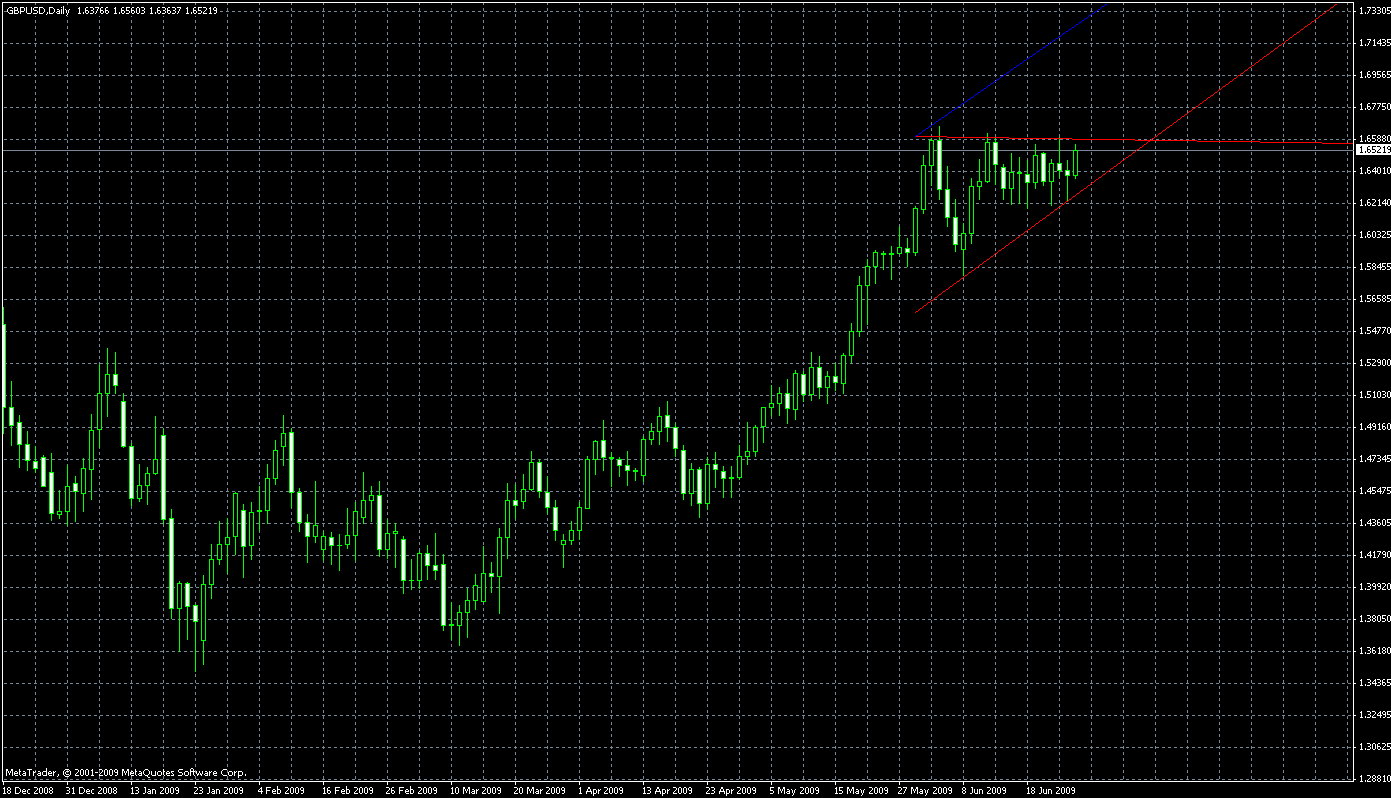
2. EUR/JPY, Daily, Rising Wedge: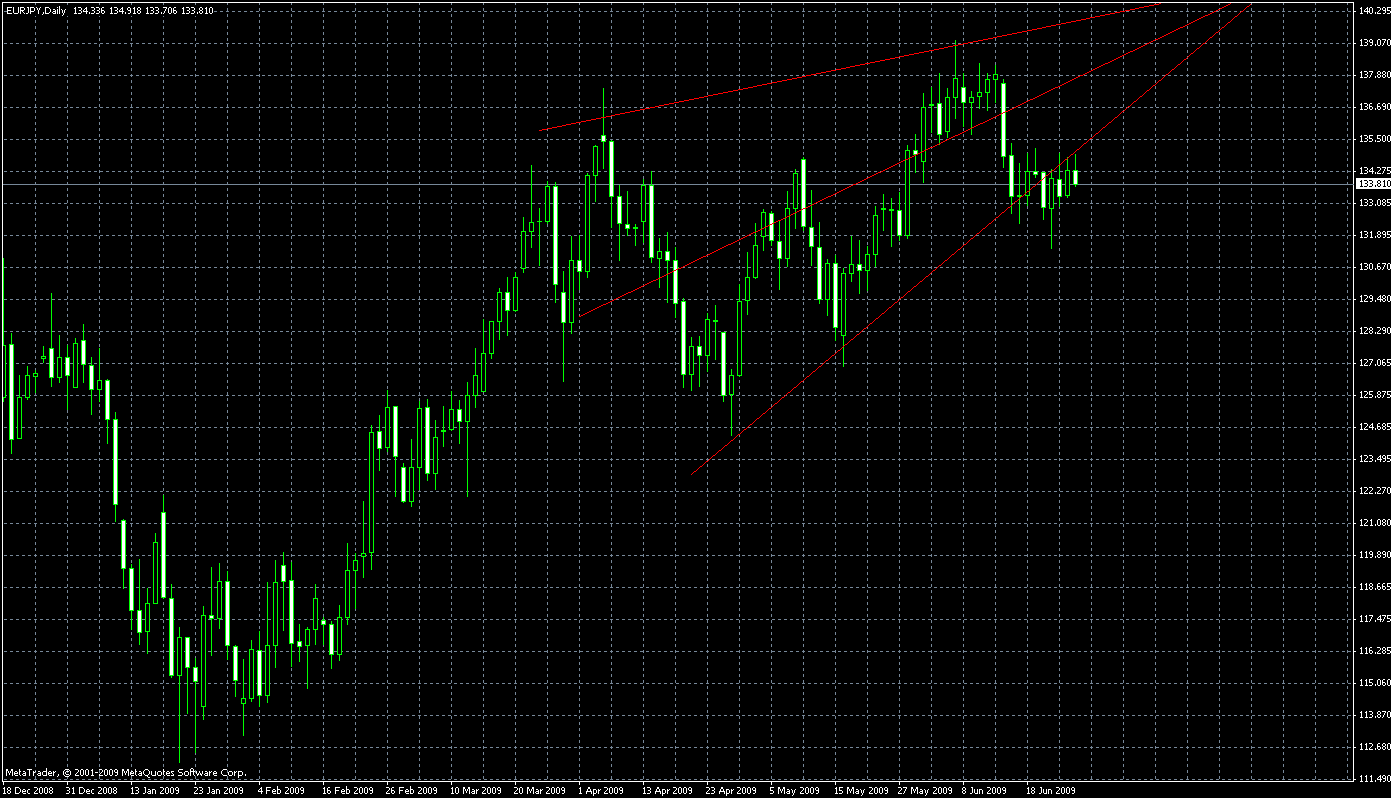
What Pairs Do You Trade?
My own experience suggests that the majority of the traders usually trades on 2 or 3 preferred Forex pairs that usually include EUR/USD, GBP/USD and USD/JPY, while not many go into other major crosses with an extremely low number of traders touching something exotic like USD/BRL or NZD/CHF. In Forex different currency pairs are interconnected and there is no real diversification possible contrary to the stock markets. Some professional traders always insist on concentrating only on one pair. But I like to find opportunities in all the pairs that are supported by my broker and have sane spreads. What currency pairs do you prefer to trade? In this poll you can select multiple answers if you trade on more than one currency pair.
What currency pairs do you trade?
EUR/USD Shows Spike on Consumer Confidence Decline
Dollar was losing against the euro during the first half of the trading session today but managed to regain it’s position after some important fundamental reports were released in United States. The negative values in the reports made traders to go for the «safer» dollar. EUR/USD is now trading near 1.4042.
S&P/Case-Shiller seasonally adjusted home price index for the 20 U.S. states declined by 18.1% in April compared to the last year, following 18.7% drop in March. The average forecast for this index yearly change was at -18.63%.
Consumer confidence unexpectedly dropped at a very fast pace — to 49.3 in June from 54.8 in May. It was expected to go up to 55.3.
Chicago PMI business barometer index rose from 34.9 to 39.9 in June. It exceeded the median forecast of 39 for this indicator.
EUR/USD Propels on Improved Macroeconomics
The euro rose against the dollar today as some important economic indicators in U.S. showed a recovery from the global crisis, while only construction spending report showed a negative dynamics. EUR/USD is now trading near 1.4171 — the highest value since June 5.
ADP employment report for June showed a decrease by 473k jobs during that month, but that was considered a positive signal since it was less than 485k decline demonstrated in May (positively revised from 532k drop). According to the consensus forecast, jobs were expected to fall by 394k in June.
Construction spending fell in May by 0.9% after rising by 0.6% a month earlier. It was expected to decrease by only 0.6%.
ISM manufacturing index advanced from 42.8% to 44.8% in June — slightly higher than the forecast suggested (44%).
Pending home sales index rose for the fourth consecutive month in U.S. and gained 0.1% in May, following 3.3% gain in April.
U.S. crude oil inventories continued to fall last week and decreased by 3.7 million barrels.
Dollar Rises as Nonfarm Payrolls Drop Fast
EUR/USD declined past the yesterday’s open level today as the currency traders reacted on the deeper than expected drop in the U.S. nonfarm payrolls. Worsening of the employment market situation spurs speculations that the recovery from the current crisis may be quite far from now. Going into more risky currencies isn’t a good choice in this case. EUR/USD is now trading near 1.4010.
Nonfarm payrolls declined by 467k in June, following 322k drop in May. The payrolls were expected to go down by 365k according to forecasts. Overall unemployment rate increased from 9.4% to 9.5%.
Initial jobless claims were at 614k last week, down from 630k reported a week earlier. The report went out almost matching the forecast which was at 615k.
Factory orders increased by 1.2% in May, following 0.5% rise in April (revised negatively from 0.7%). The market expected a 0.9% increase.
Detect Chart Extrema with Improved ZigZag Indicator
You’ve probably seen the standard MetaTrader ZigZag indicator that is capable of drawing lines from one chart extremum to another. It looks good and neat but it has two disadvantages: it’s not very accurate and it also has a bad delays for detection, because it is quite linear in its nature. This new improved version of the ZigZag indicator does the same — draws the lines between the chart’s extrema, but it uses Parabolic SAR (another well-known standard indicator) to find those extrema. This makes the whole calculation a dynamic process, which manages to reduce the delay between the point of extremum and its detection point.
The resulting extrema may be used to build regression channels or the chart patterns (like triangles and wedges) as you wish. You can find more information about this indicator and also download it for freeEbook Forex Trading and Commodity,
3 Swing Trading Examples, With Charts, Instructions, &Definitions To Get You Started
7 Habits Of A Higly Sucsessfull Trader
18 Trading Champions Share Their Keys To Top Trading Profits
25 rules of trading
123 Trading Signa(Mark Crisp)
A Comparison Of Dividend Cash Flow And Earnings Approaches To Equity Valuation
A Course In Miracles
Alan Farley - The Master Swing Trader9.Andrew Willis - The Insiders Guide to Trading the World Stock Markets
Asset Valuation Allocation Models
Barbara Star - Hidden Divergence
Barry Rudd - Stock Patterns For Day Trading And Swing Trading
Ben Branch - The Predictive Power of Stock Market Indicator
Bernstein Stock Market Trading Course
Bill Williams - Trading Chaos
Bollinger On Bollinger Band
Borsellino Lewis 2001 - Trading Es And Nq Futures Course18.Building Winning Trading Systems With Tradestation - Wiley
Building Your E-Mini Trading Strategy - Giuciao.Atspace.Org
C.C.Gaither, A.E.Cavazos-Gaither - Statistically Speaking - A Dictionary of Quotations
Calming The Mind
CBOT - A Six-Part Study Guide to Market Profile
Chan, Jegadeesh & Lakonishok - Momentum Strategies24.Chande, Tushar - Technical Analysis - How to Develop and Imp
Forex
The FX market, you buy or sell currencies. Placing a trade in the foreign exchange market is simple: the mechanics of a trade are very similar to those found in other markets (like the stock market), so if you have any experience in trading, you should be able to pick it up pretty quickly.
The object of Forex trading is to exchange one currency for another in the expectation that the price will change, so that the currency you bought will increase in value compared to the one you sold.
Example of making money by buying Euros
Trader's Action EUR USD You purchase 10,000 euros at the EUR/USD exchange rate of 1.18
Two weeks later, you exchange your 10,000 euros back into US dollars at the exchange rate of 1.2500.
you earn a profit of $700. 0 +700
EUR $10,000 x 1.18 = US $11,800
EUR $10,000 x 1.25 = US $12,500
An exchange rate is simply the ratio of one currency valued against another currency. For example, the USD/CHF exchange rate indicates how many U.S. dollars can purchase one Swiss franc, or how many Swiss francs you need to buy one U.S. dollar. How to Read an FX Quote Currencies are always quoted in pairs, such as GBP/USD or USD/JPY. The reason they are quoted in pairs is because in every foreign exchange transaction you are simultaneously buying one currency and selling another. Here is an example of a foreign exchange rate for the British pound versus the U.S. dollar:
GBP/USD = 1.7500
The first listed currency to the left of the slash ("/") is known as the base currency (in this example, the British pound), while the second one on the right is called the counter or quote currency (in this example, the U.S. dollar). When buying, the exchange rate tells you how much you have to pay in units of the quote currency to buy one unit of the base currency. In the example above, you have to pay 1.7500 U.S. dollar to buy 1 British pound. When selling, the exchange rate tells you how many units of the quote currency you get for selling one unit of the base currency. In the example above, you will receive 1.7500 U.S. dollars when you sell 1 British pound. The base currency is the “basis” for the buy or the sell. If you buy EUR/USD this simply
means that you are buying the base currency and simultaneously selling the quote currency.
You would buy the pair if you believe the base currency will appreciate (go up) relative to the quote currency. You would sell the pair if you think the base currency will depreciate (go down) relative to the quote currency.
Long/Short
First, you should determine whether you want to buy or sell. If you want to buy (which actually means buy the base currency and sell the quote currency), you want the base currency to rise in value and then you would sell it back at a higher price. In trader's talk, this is called "going long" or taking a "long position". Just remember: long = buy.
If you want to sell (which actually means sell the base currency and buy the quote currency), you want the base currency to fall in value and then you would buy it back at a lower price. This is called "going short" or taking a "short position". Short = sell. Bid/Ask Spread
All Forex quotes include a two-way price, the bid and ask. The bid is always lower than the ask price. The bid is the price in which the dealer is willing to buy the base currency in exchange for the quote currency. This means the bid is the price at which you (as the trader) will sell. The ask is the price at which the dealer will sell the base currency in exchange for the quote currency. This means the ask is the price at which you will buy. The difference between the bid and the ask price is popularly known as the spread. Let's take a look at an example of a price quote taken from a trading platform:
On this GBP/USD quote, the bid price is 1.7445 and the ask price
is 1.7449. Look at how this broker makes it so easy for you to
trade away your money.
If you want to sell GBP, you click "Sell" and you will sell pounds
at 1.7445. If you want to buy GBP, you click "Buy" and you will
buy pounds at 1.7449.
In the following examples, we're going to use fundamental analysis to help us decide whether to buy or sell a specific currency pair. If you always fell asleep during your economics class or just flat out skipped economics class, don’t worry! We will cover fundamental analysis in a later lesson. For right now, try to pretend you know what’s going on…
EUR/USD
In this example Euro is the base currency and thus the “basis” for the buy/sell. If you believe that the US economy will continue to weaken, which is bad for the US dollar, you would execute a BUY EUR/USD order. By doing so you have bought euros in the expectation that they will rise versus the US dollar. if you believe that the US economy is strong and the euro will weaken against the US dollar you would execute a SELL EUR/USD order. By doing so you have sold Euros in the expectation that they will fall versus the US dollar.
USD/JPY
In this example the US dollar is the base currency and thus the “basis” for the buy/sell. If you think that the Japanese government is going to weaken the Yen in order to help its export industry, you would execute a BUY USD/JPY order. By doing so you have bought U.S dollars in the expectation that they will rise versus the Japanese yen. If you believe that Japanese investors are pulling money out of U.S. financial markets and converting all their U.S. dollars back to Yen, and this will hurt the US dollar, you would execute a SELL USD/JPY order. By doing so you have sold U.S dollars in the expectation that they will depreciate against the Japanese yen.
GBP/USD
In this example the GBP is the base currency and thus the “basis” for the buy/sell. If you think the British economy will continue to do better than the United States in terms of economic growth, you would execute a BUY GBP/USD order. By doing so you have bought pounds in the expectation that they will rise versus the US dollar. If you believe the British's economy is slowing while the United State's economy remains strong like bull, you would execute a SELL GBP/USD order. By doing so you have sold pounds in the expectation that they will depreciate against the US dollar.
USD/CHF
In this example the USD is the base currency and thus the “basis” for the buy/sell. If you think the Swiss franc is overvalued, you would execute a BUY USD/CHF order. By doing so you have bought US dollars in the expectation that they will appreciate versus the Swiss Franc. If you believe that the US housing market bubble burst will hurt future economic growth, which will weaken the dollar, you would execute a SELL USD/CHF order. By doing so you have sold US dollars in the expectation that they will depreciate against the Swiss franc. I don't have enough money to buy $10,000 euros. Can I still trade?
You can with margin trading! Margin trading is simply the term used for trading with borrowed capital. This is how you're able to open $10,000 or $100,000 positions with as little as $50 or $1,000. You can conduct relatively large transactions, very quickly and cheaply, with a small amount of initial capital. Margin trading in the foreign exchange market is quantified in “lots”. For now, just think of the term "lot" as the minimum amount of currency you have to buy. When you go to the grocery store and want to buy an egg, you can't just buy a single egg; they come in dozens or "lots" of 12. In Forex, it would be just as foolish to buy or sell $1 EUR, so they usually come in "lots" of $10,000 or $100,000 depending on the type of account you have.
For Example:
• You believe that signals in the market are indicating that the British Pound will go up
against the US Dollar.
• You open 1 lot ($100,000) for buying the Pound with a 1% margin at the price of
1.5000 and wait for the exchange rate to climb. This means you now control $100,000
worth of British Pound with $1,000. Your predictions come true and you decide to
sell.
• You close the position at 1.5050. You earn 50 pips or about $500. (A pip is the
smallest price movement available in a currency). So for an initial capital investment
of $1,000, you have made 50% return. Return equals your $500 profit divided by your
$1,000 you risked to trade.
Your Actions GBP USD
Your Money
You buy 100,000 pounds at the GBP/USD exchange
rate of 1.5000
+100,000 -150,000 $1,000
You blink for two seconds and the GBP/USD
exchange rate rises to 1.5050 and you sell.
-100,000 +150,500** $1,500
You have earned a profit of $500. 0 +500
When you decide to close a position, the deposit that you originally made is returned to you and a calculation of your profits or losses is done. This profit or loss is then credited to your account.
We will also be discussing margin more in-depth in the next lesson, but hopefully you're
able to get a basic idea of how margin works.
The object of Forex trading is to exchange one currency for another in the expectation that the price will change, so that the currency you bought will increase in value compared to the one you sold.
Example of making money by buying Euros
Trader's Action EUR USD You purchase 10,000 euros at the EUR/USD exchange rate of 1.18
Two weeks later, you exchange your 10,000 euros back into US dollars at the exchange rate of 1.2500.
you earn a profit of $700. 0 +700
EUR $10,000 x 1.18 = US $11,800
EUR $10,000 x 1.25 = US $12,500
An exchange rate is simply the ratio of one currency valued against another currency. For example, the USD/CHF exchange rate indicates how many U.S. dollars can purchase one Swiss franc, or how many Swiss francs you need to buy one U.S. dollar. How to Read an FX Quote Currencies are always quoted in pairs, such as GBP/USD or USD/JPY. The reason they are quoted in pairs is because in every foreign exchange transaction you are simultaneously buying one currency and selling another. Here is an example of a foreign exchange rate for the British pound versus the U.S. dollar:
GBP/USD = 1.7500
The first listed currency to the left of the slash ("/") is known as the base currency (in this example, the British pound), while the second one on the right is called the counter or quote currency (in this example, the U.S. dollar). When buying, the exchange rate tells you how much you have to pay in units of the quote currency to buy one unit of the base currency. In the example above, you have to pay 1.7500 U.S. dollar to buy 1 British pound. When selling, the exchange rate tells you how many units of the quote currency you get for selling one unit of the base currency. In the example above, you will receive 1.7500 U.S. dollars when you sell 1 British pound. The base currency is the “basis” for the buy or the sell. If you buy EUR/USD this simply
means that you are buying the base currency and simultaneously selling the quote currency.
You would buy the pair if you believe the base currency will appreciate (go up) relative to the quote currency. You would sell the pair if you think the base currency will depreciate (go down) relative to the quote currency.
Long/Short
First, you should determine whether you want to buy or sell. If you want to buy (which actually means buy the base currency and sell the quote currency), you want the base currency to rise in value and then you would sell it back at a higher price. In trader's talk, this is called "going long" or taking a "long position". Just remember: long = buy.
If you want to sell (which actually means sell the base currency and buy the quote currency), you want the base currency to fall in value and then you would buy it back at a lower price. This is called "going short" or taking a "short position". Short = sell. Bid/Ask Spread
All Forex quotes include a two-way price, the bid and ask. The bid is always lower than the ask price. The bid is the price in which the dealer is willing to buy the base currency in exchange for the quote currency. This means the bid is the price at which you (as the trader) will sell. The ask is the price at which the dealer will sell the base currency in exchange for the quote currency. This means the ask is the price at which you will buy. The difference between the bid and the ask price is popularly known as the spread. Let's take a look at an example of a price quote taken from a trading platform:
On this GBP/USD quote, the bid price is 1.7445 and the ask price
is 1.7449. Look at how this broker makes it so easy for you to
trade away your money.
If you want to sell GBP, you click "Sell" and you will sell pounds
at 1.7445. If you want to buy GBP, you click "Buy" and you will
buy pounds at 1.7449.
In the following examples, we're going to use fundamental analysis to help us decide whether to buy or sell a specific currency pair. If you always fell asleep during your economics class or just flat out skipped economics class, don’t worry! We will cover fundamental analysis in a later lesson. For right now, try to pretend you know what’s going on…
EUR/USD
In this example Euro is the base currency and thus the “basis” for the buy/sell. If you believe that the US economy will continue to weaken, which is bad for the US dollar, you would execute a BUY EUR/USD order. By doing so you have bought euros in the expectation that they will rise versus the US dollar. if you believe that the US economy is strong and the euro will weaken against the US dollar you would execute a SELL EUR/USD order. By doing so you have sold Euros in the expectation that they will fall versus the US dollar.
USD/JPY
In this example the US dollar is the base currency and thus the “basis” for the buy/sell. If you think that the Japanese government is going to weaken the Yen in order to help its export industry, you would execute a BUY USD/JPY order. By doing so you have bought U.S dollars in the expectation that they will rise versus the Japanese yen. If you believe that Japanese investors are pulling money out of U.S. financial markets and converting all their U.S. dollars back to Yen, and this will hurt the US dollar, you would execute a SELL USD/JPY order. By doing so you have sold U.S dollars in the expectation that they will depreciate against the Japanese yen.
GBP/USD
In this example the GBP is the base currency and thus the “basis” for the buy/sell. If you think the British economy will continue to do better than the United States in terms of economic growth, you would execute a BUY GBP/USD order. By doing so you have bought pounds in the expectation that they will rise versus the US dollar. If you believe the British's economy is slowing while the United State's economy remains strong like bull, you would execute a SELL GBP/USD order. By doing so you have sold pounds in the expectation that they will depreciate against the US dollar.
USD/CHF
In this example the USD is the base currency and thus the “basis” for the buy/sell. If you think the Swiss franc is overvalued, you would execute a BUY USD/CHF order. By doing so you have bought US dollars in the expectation that they will appreciate versus the Swiss Franc. If you believe that the US housing market bubble burst will hurt future economic growth, which will weaken the dollar, you would execute a SELL USD/CHF order. By doing so you have sold US dollars in the expectation that they will depreciate against the Swiss franc. I don't have enough money to buy $10,000 euros. Can I still trade?
You can with margin trading! Margin trading is simply the term used for trading with borrowed capital. This is how you're able to open $10,000 or $100,000 positions with as little as $50 or $1,000. You can conduct relatively large transactions, very quickly and cheaply, with a small amount of initial capital. Margin trading in the foreign exchange market is quantified in “lots”. For now, just think of the term "lot" as the minimum amount of currency you have to buy. When you go to the grocery store and want to buy an egg, you can't just buy a single egg; they come in dozens or "lots" of 12. In Forex, it would be just as foolish to buy or sell $1 EUR, so they usually come in "lots" of $10,000 or $100,000 depending on the type of account you have.
For Example:
• You believe that signals in the market are indicating that the British Pound will go up
against the US Dollar.
• You open 1 lot ($100,000) for buying the Pound with a 1% margin at the price of
1.5000 and wait for the exchange rate to climb. This means you now control $100,000
worth of British Pound with $1,000. Your predictions come true and you decide to
sell.
• You close the position at 1.5050. You earn 50 pips or about $500. (A pip is the
smallest price movement available in a currency). So for an initial capital investment
of $1,000, you have made 50% return. Return equals your $500 profit divided by your
$1,000 you risked to trade.
Your Actions GBP USD
Your Money
You buy 100,000 pounds at the GBP/USD exchange
rate of 1.5000
+100,000 -150,000 $1,000
You blink for two seconds and the GBP/USD
exchange rate rises to 1.5050 and you sell.
-100,000 +150,500** $1,500
You have earned a profit of $500. 0 +500
When you decide to close a position, the deposit that you originally made is returned to you and a calculation of your profits or losses is done. This profit or loss is then credited to your account.
We will also be discussing margin more in-depth in the next lesson, but hopefully you're
able to get a basic idea of how margin works.
Ebook Forex Trading and Commodity
Sfo Raschke
Simple Technical Trading Rules and the Stochastic Properties
Stephen W Bigalow - Big Profit Patterns Using Candlestick
Steve Mitchell - Shortcuts & Secrets To Winning The Stockmarket Game
Stochastic Modeling In Economics And Finance.djvu
Stockmarket
Strategic Analysis and Trading Tactics
Simple Technical Trading Rules and the Stochastic Properties
Stephen W Bigalow - Big Profit Patterns Using Candlestick
Steve Mitchell - Shortcuts & Secrets To Winning The Stockmarket Game
Stochastic Modeling In Economics And Finance.djvu
Stockmarket
Strategic Analysis and Trading Tactics
Subscribe to:
Posts (Atom)